NOTE
Effective November 2020:
- Common Data Service has been renamed to Microsoft Dataverse. Learn more
- Some terminology in Microsoft Dataverse has been updated. For example, entity is now table and field is now column. Learn more
LAB 05: Power BI
In this lab, you will build a Power BI dashboard that visualizes data about problems reported by company employees.
What you will learn
- How to connect to Dataverse
- How to refine the data model and prepare it for reporting
- How to create a Power BI visualization
- How to embed a Power BI report in Microsoft Teams
High-level lab steps
We will follow the below steps to design and create the Power BI dashboard:
- Connect to tables in Microsoft Dataverse
- Transform the data to include user-friendly descriptions for the related Rows (lookups)
- Create and publish a report with various visualizations of the information about problem reports
- User natural language query to build additional visualizations
- Build mobile view
- Embed the Company 311 Power BI report to Microsoft Teams
Prerequisites
- Must have completed Lab 02.1: Data model and model-driven app
- Permissions to install programs on your computer (required for Power BI Desktop installation)
Things to consider before you begin
- Who is the target audience of the report?
- How will the audience consume the report? Typical device? Location?
- Do you have sufficient data to visualize?
- What are the possible characteristics you can use to analyze data about the visits?
Detailed steps
Exercise 1: Prepare environment & data
Objective: In this exercise, you will install and configure Power BI Desktop and configure a connection to Microsoft Dataverse.
IMPORTANT
If you do not have required permissions to install desktop applications or experience difficulties in configuring Power BI Desktop and connecting it to the data, follow Addendum: Import sample data and then continue on Exercise 2 but using Power BI service instead of Power BI Desktop.
Task 1: Configure Power BI Desktop
- If you do not have Power BI Desktop installed, navigate to https://aka.ms/pbidesktopstore to download and install Power BI app.
IMPORTANT
If you experience issues installing Power BI Desktop using Microsoft Store, try standalone installer that can be downloaded from https://aka.ms/pbiSingleInstaller.
- Open Power BI Desktop.
-
If you signed in into Power BI Desktop previously, select **File Sign out** -
Sign in if prompted or select **File Sign in** to sign in. - If you’re signing in for the first time you may receive the following prompt
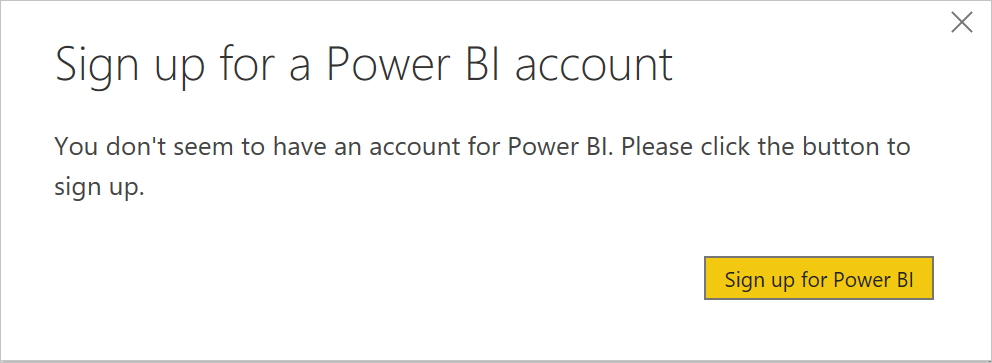
- Select Sign up for Power BI and follow the prompts to complete the sign up
Task 2: Prepare Data
-
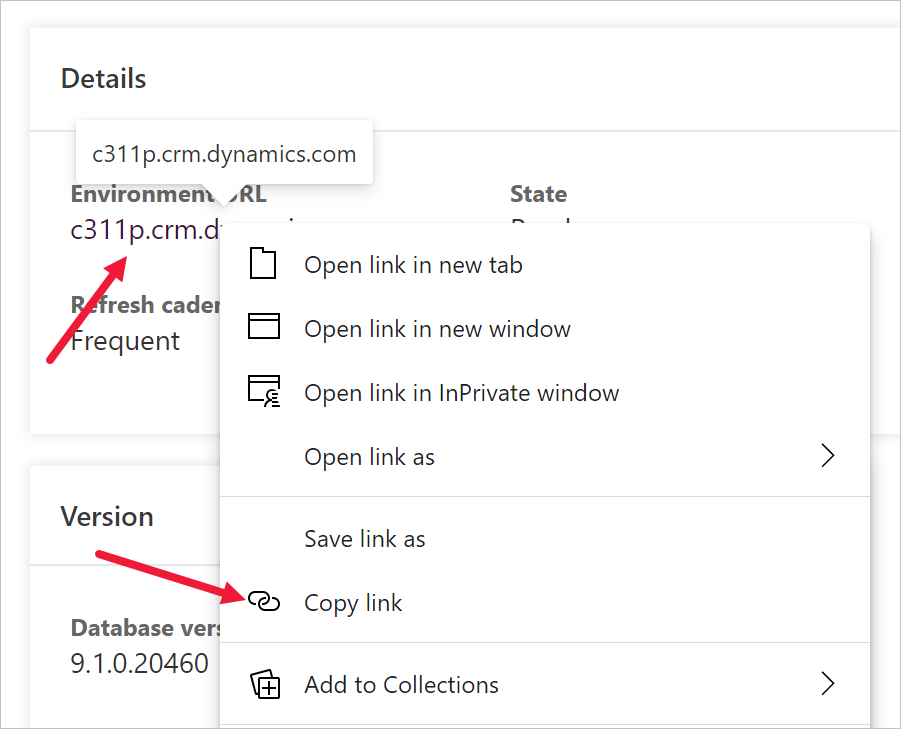
Find out your organization URL
- Navigate to Power Platform Admin Center.
- In the left navigation page, select Environments, and then click on the target environment.
- Right mouse click Environment URL on the Details panel, then select Copy link.
- Switch to Power BI desktop.
-
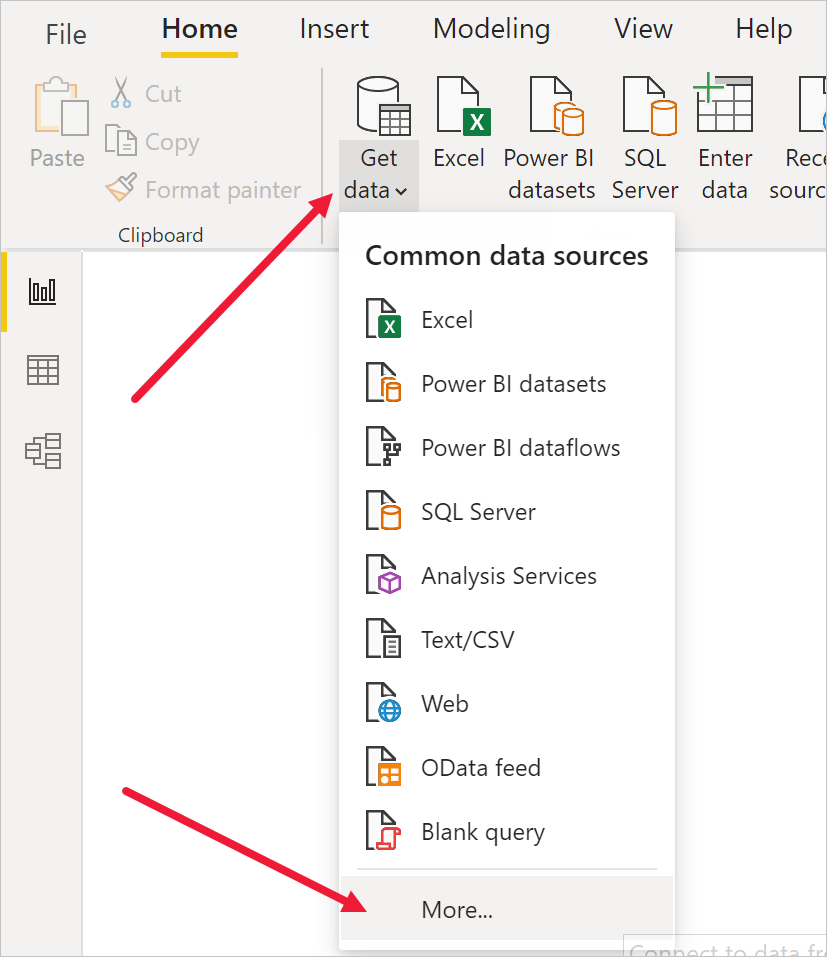
Select **Get data More…**
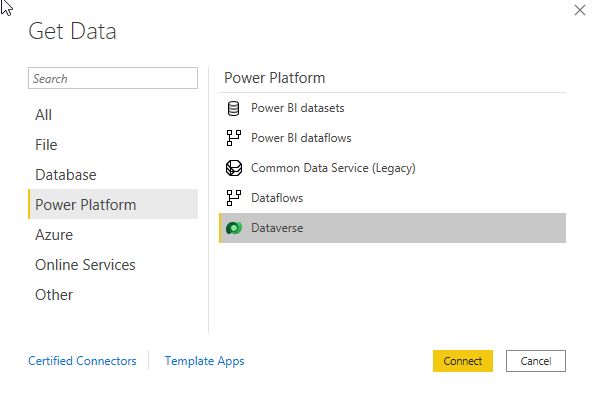
- Select Power Platform, then select Dataverse and press Connect.
- Paste the environment URL you copied earlier without the https://, select DirectQuery, and click OK.

-
The connection details dialog will open up. If you are not signed in, click Sign in and follow the prompts to sign in. Press Connect.
-
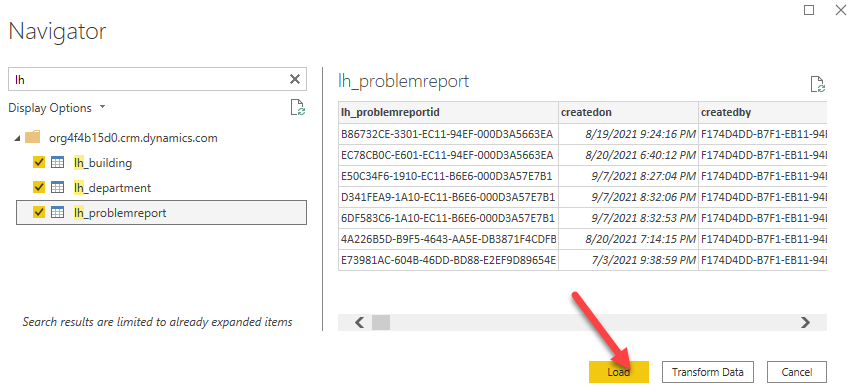
Expand environment node, select lh_Building, lh_Department, lh_ProblemReport tables and select Load. Wait until the load is complete.
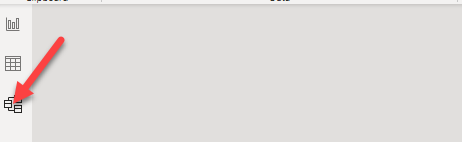
- Click Model icon on the left vertical toolbar.
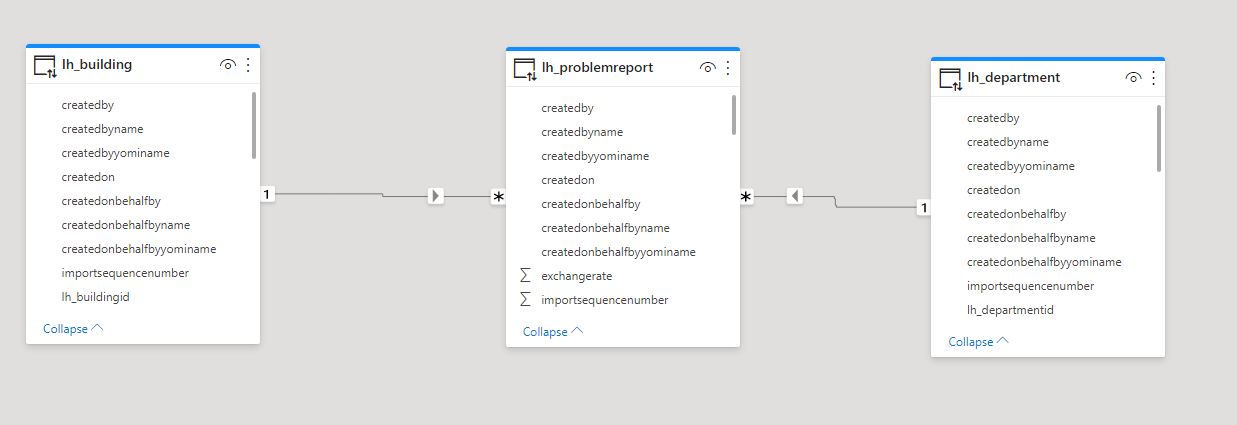
- Power BI should detect the relationship between the table. The relationship should look like the image below.
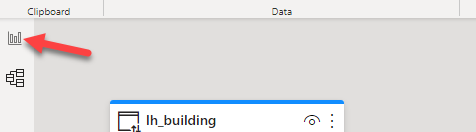
- Select Report icon on the left toolbar.
-
Expand lh_ProblemReports node in the Fields panel.
-
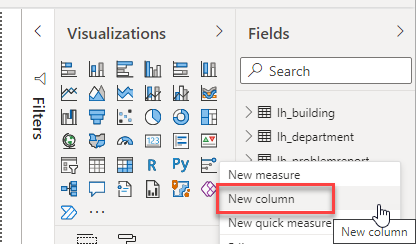
Click on the … More options button of the lh_ProblemReports table.
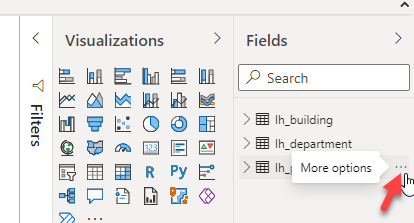
- Select New column.
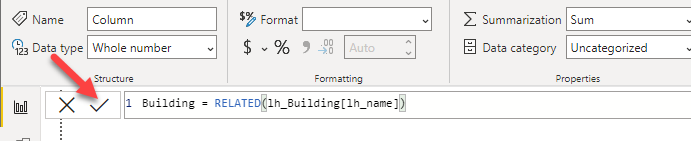
- Complete the formula as below and press ENTER or click checkmark button. That will add a new column with the building name into the problem report data.
Building = RELATED(lh_Building[lh_name])
- Repeat the three previous steps on lh_problemreports node to add a column Department with the below formula.
Department = RELATED(lh_Department[lh_name])
- Click … next on the lh_problemreportid column of the lh_problemreport table and select Rename. Enter Problem Report as the column name.
- Click … next on the statuscodename column and select Rename. Enter Status as the column name.
- Save work in progress by pressing File | Save and enter Problem management as a filename.
Exercise 2: Create Power BI Report
Objective: In this exercise, you will create a Power BI report based on data from Microsoft Dataverse tables.
Task 1: Create Chart and Time Visualizations
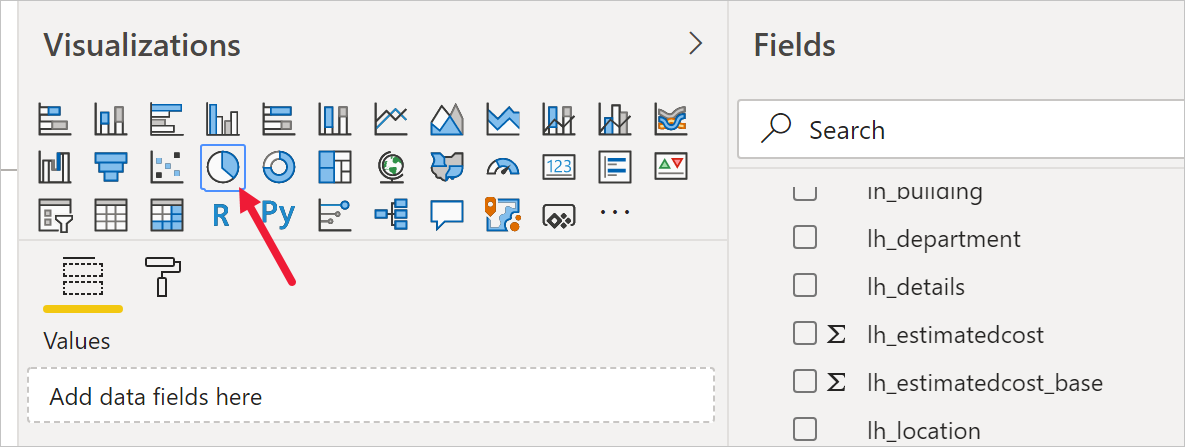
- Click on Pie chart icon in the Visualizations panel to insert the chart.
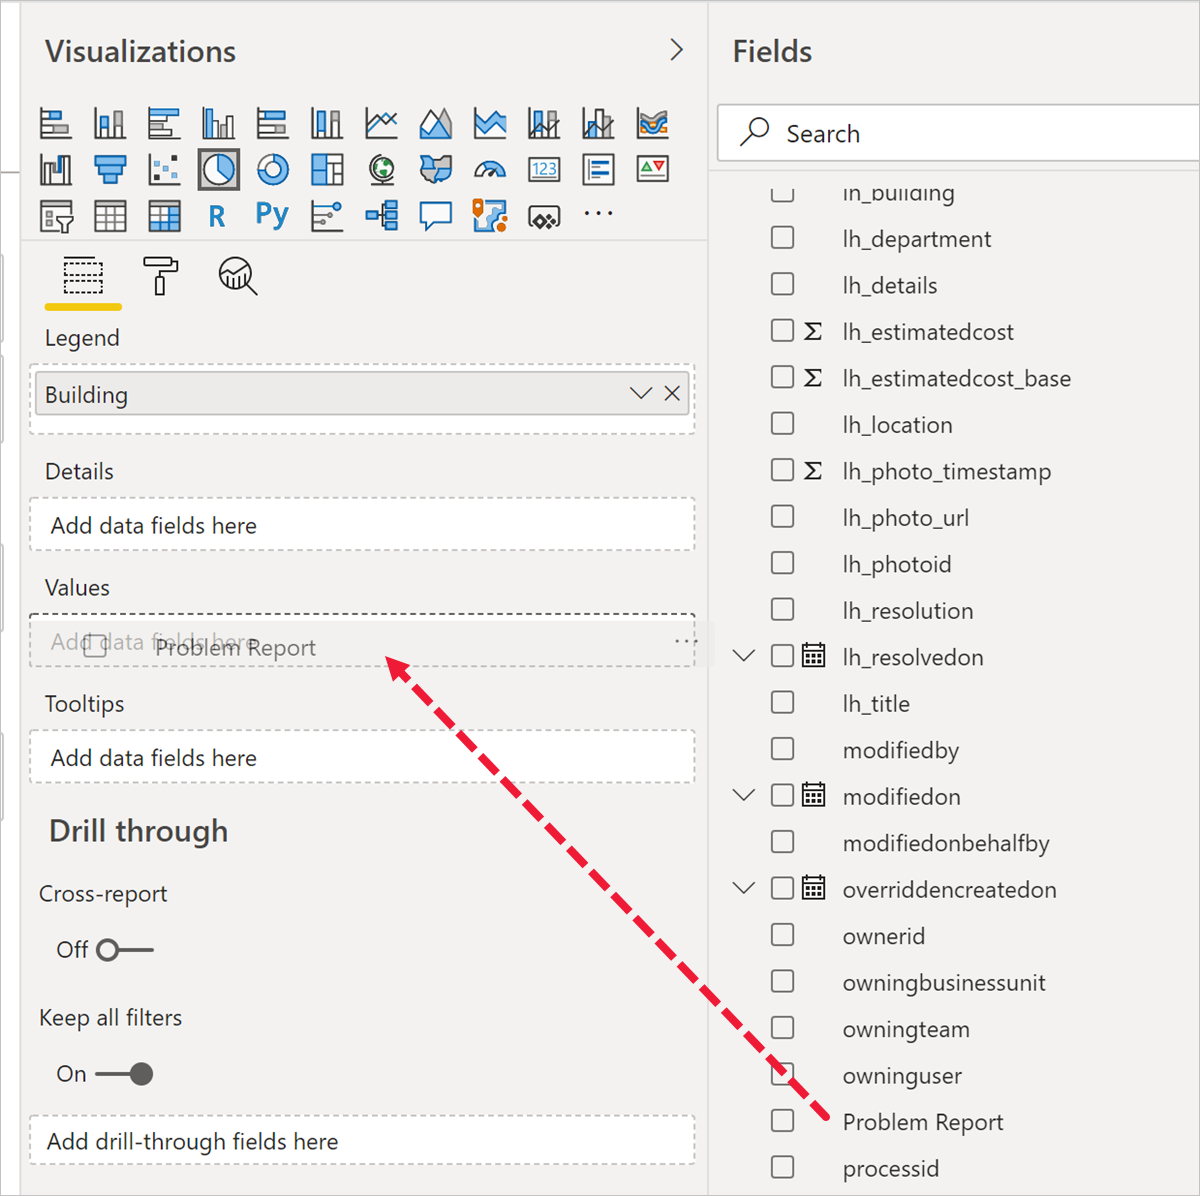
- Expand lh_ProblemReport table in the Fields panel, drag Building Column and drop it into Legend target box.
- Drag Problem Report Column and drop it into Values target box.
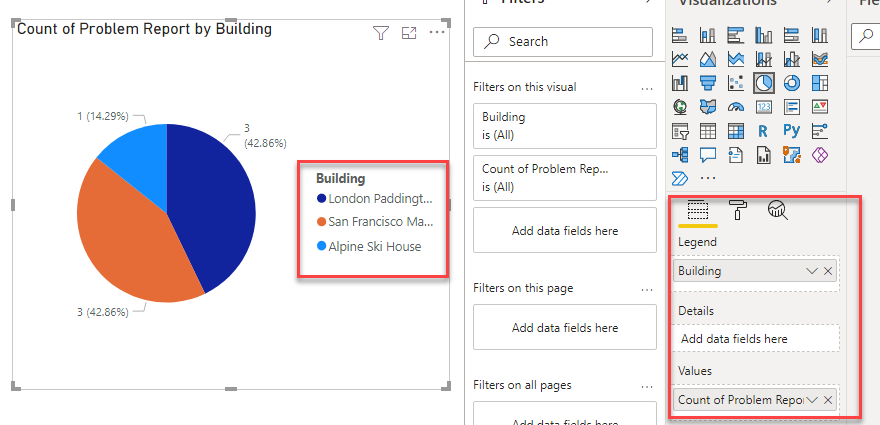
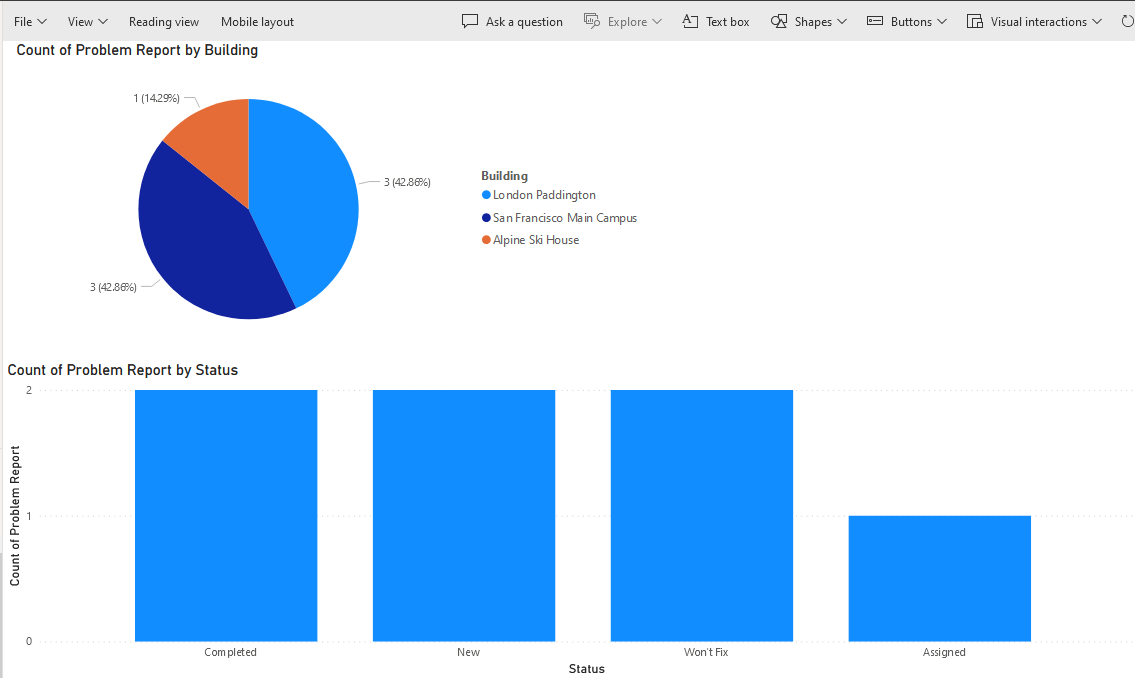
- Resize the pie chart using corner handles so that all chart components are visible. Your report should now look like this:
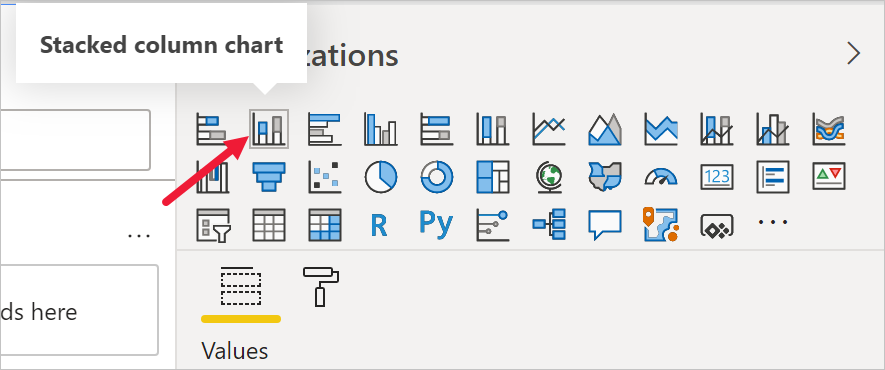
- Click on the report’s design surface outside of the chart area. Click New visual on the Power BI ribbon then select stacked column chart in Visualizations pane.
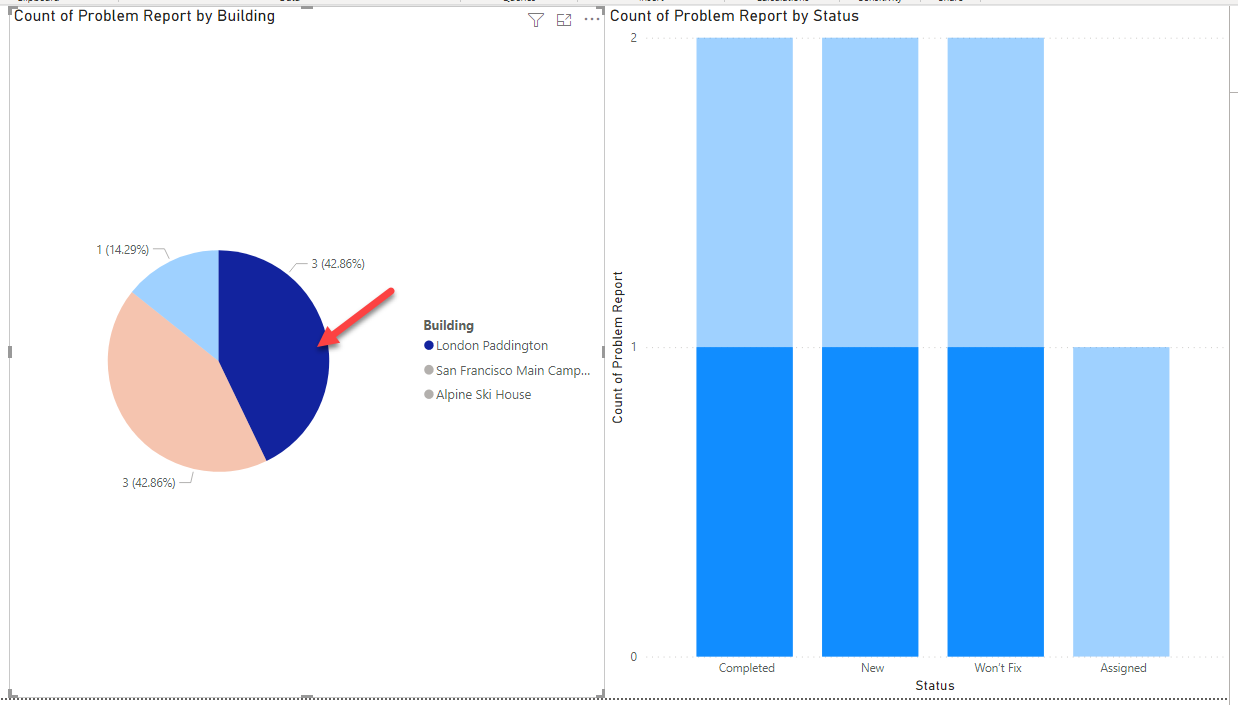
- Drag Problem Report Column and drop it into Y-axis target box.
- Drag Status Column and drop it into X-axis target box.
- Resize the chart as required using the corner handles.
-
Test the report interactivity:
- Select various building slices on the pie chart and observe changes on the stacked column chart.
- Select various bars on the stacked column chart and observe changes on the pie report.
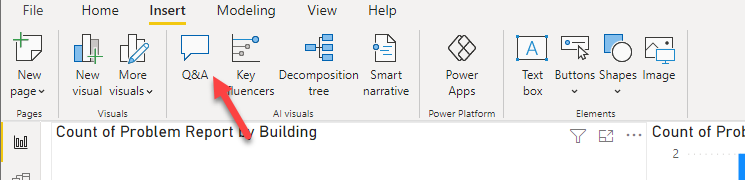
- Select the Insert, and click Q&A.
- Select Turn on Q&A and wait for the Q&A to get ready.
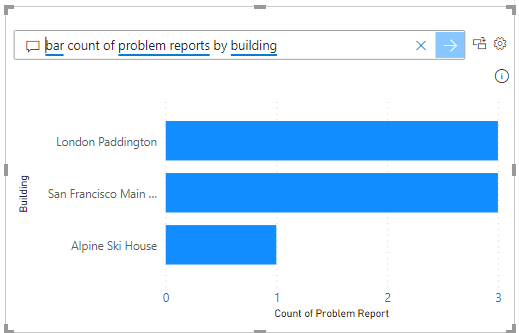
- Type bar count of problem reports by building and hit enter. You should see a bar chart.
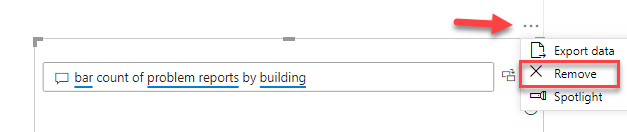
- The dashboard now has Q&A enabled. Click on the … More options button of the Q&A visual and click Remove.
-
Save work in progress by selecting **File Save**.
Exercise 3: Create Power BI Dashboard
Task 1: Publish Power BI Report
- Navigate to Power BI Service
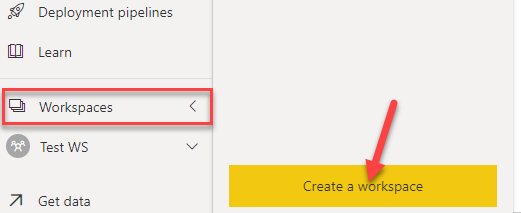
- Select Workspaces and click Create a workspace.
- Enter 311 Workspace for Workspace name and click Save.
- Go back to the Power BI desktop application, select the Home tab, and click Publish .
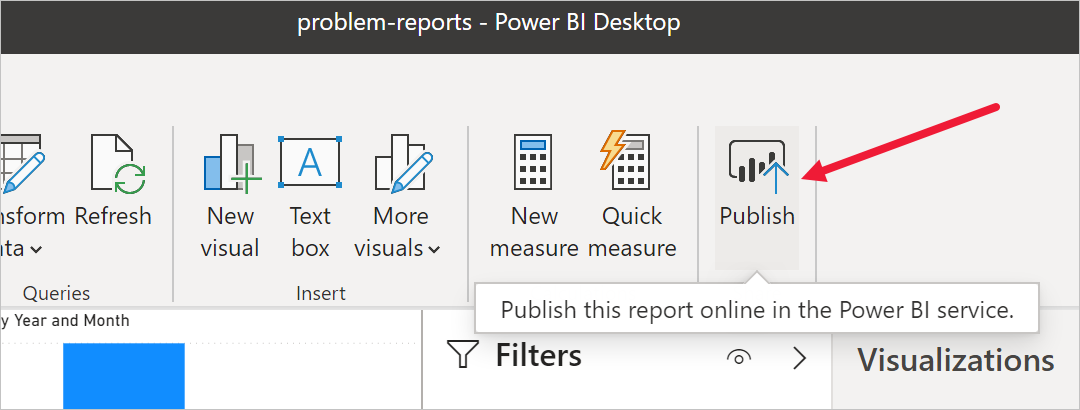
-
Select 311 Workspace as the destination, then click Select.
-
Wait until publishing is complete and click Open <name of your report>.pbix in Power BI.
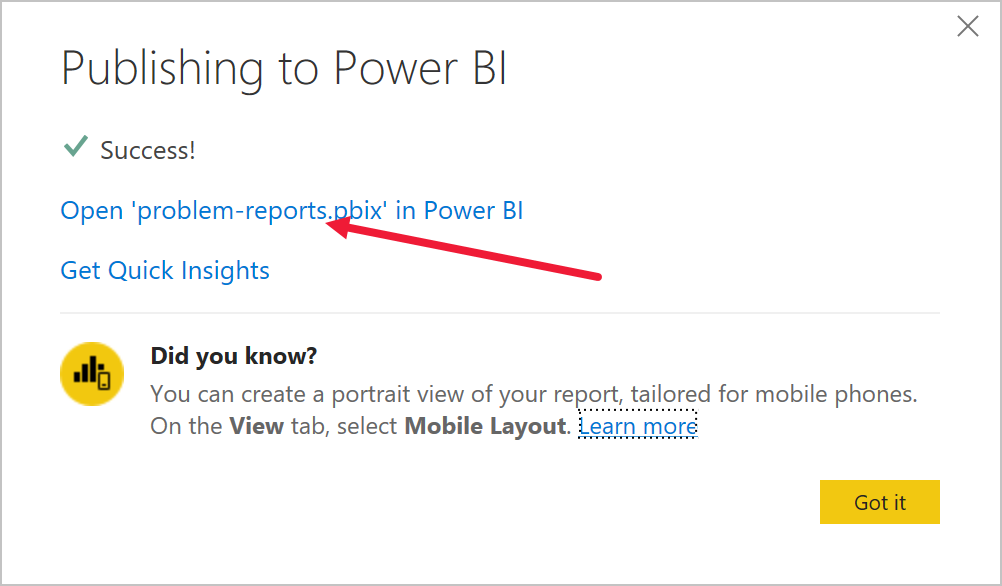
This will open the published report in the browser.
NOTE
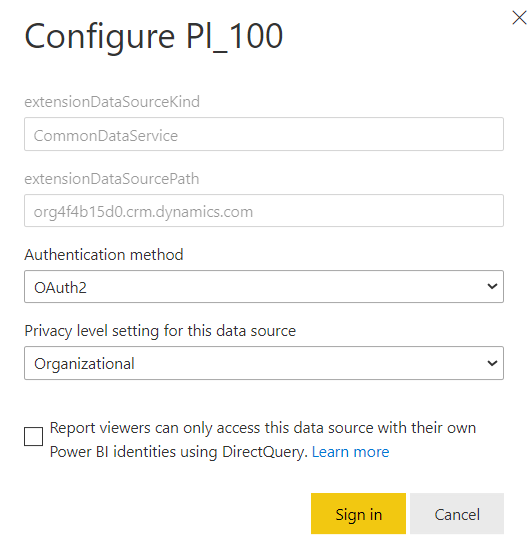
If you are getting an error on PowerBI Service with message “the data source is missing credentials and cannot be accessed”, follow the below steps:
- Select 311 Workspace and select Problem Management dataset.
- Expand Refresh dropdown and select Schedule refresh.
- Expand Data Source credentials section and select Edit Credentials.
- Select OAuth2 for Authentication Method and Organizational for Privacy level setting.
- Select Sign In. This will resolve the issue for report and it should display properly on Power BI Service.
Task 2: Create Power BI Dashboard
- Expand 311 Workspace.
- Select the Problem management report under Reports heading.
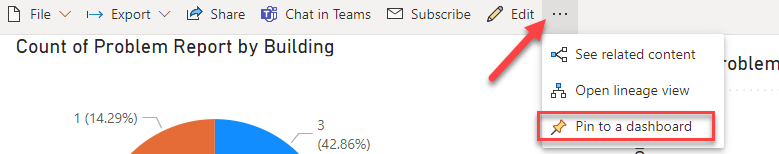
- Select Pin to a dashboard on the menu. Depending on the layout you may need to press … to show additional menu items.
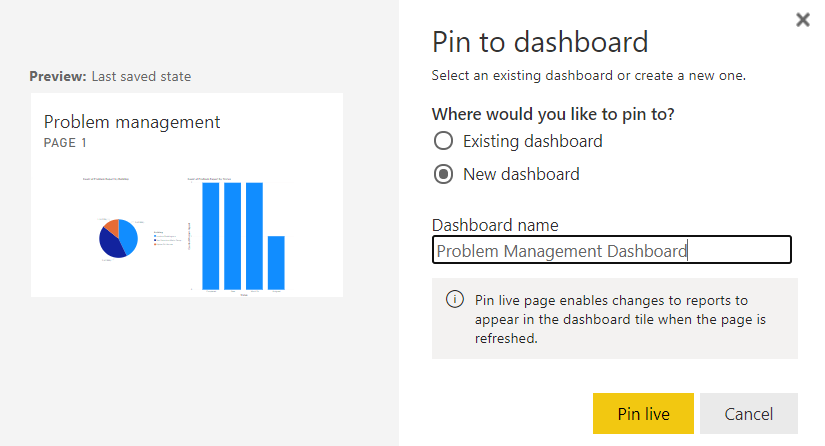
- Select New dashboard on Pin to dashboard prompt.
- Enter Problem Management Dashboard as a Dashboard name, select Pin live.
- Select 311 Workspace node, select Problem Management Dashboard.
- Test interactivity of the pie and bar charts that are displayed.
Task 3: Add Visualizations Using Natural Language
- Select Ask a question about your data on top of the dashboard.
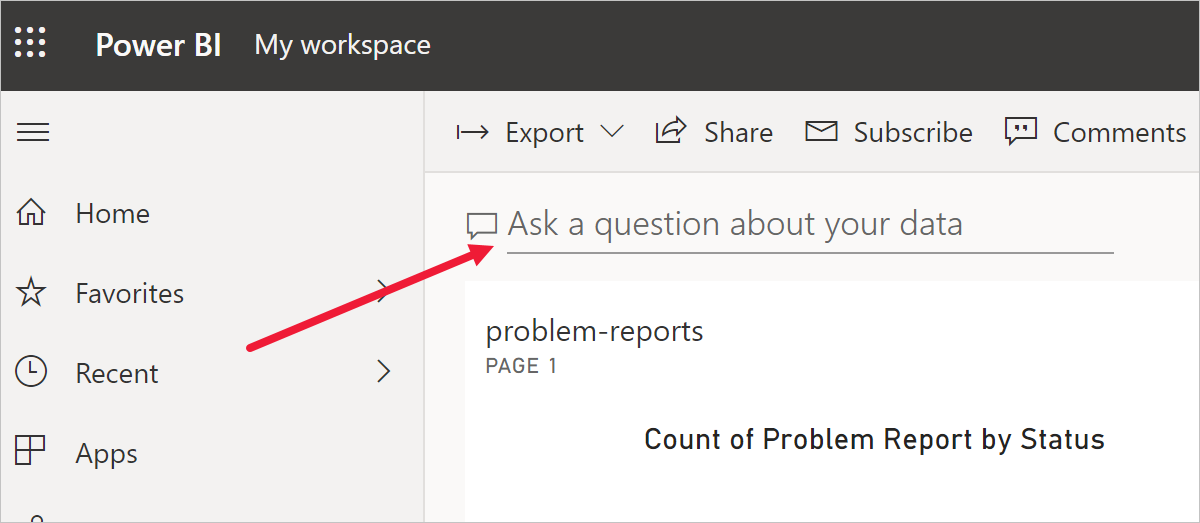
- Enter funnel count of problem reports by status in Q&A area. The funnel chart will be displayed.
- Select Pin visual.
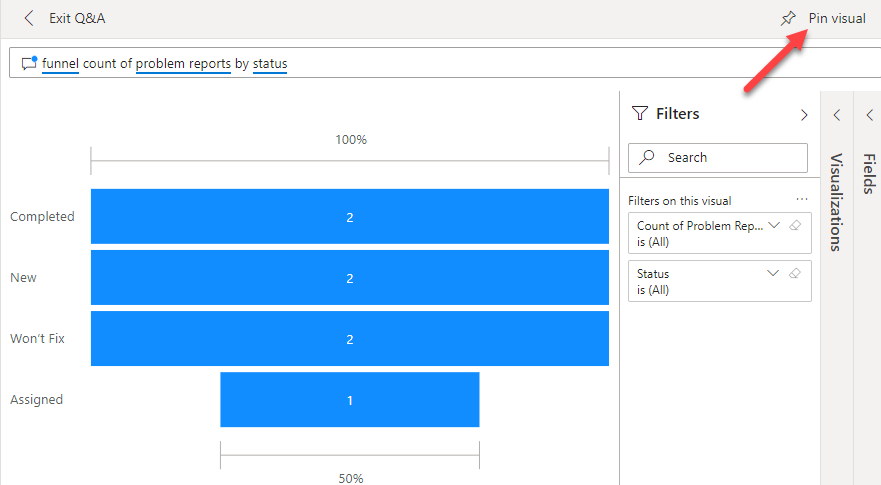
- Select Existing dashboard, select Problem Management dashboard, select Pin.
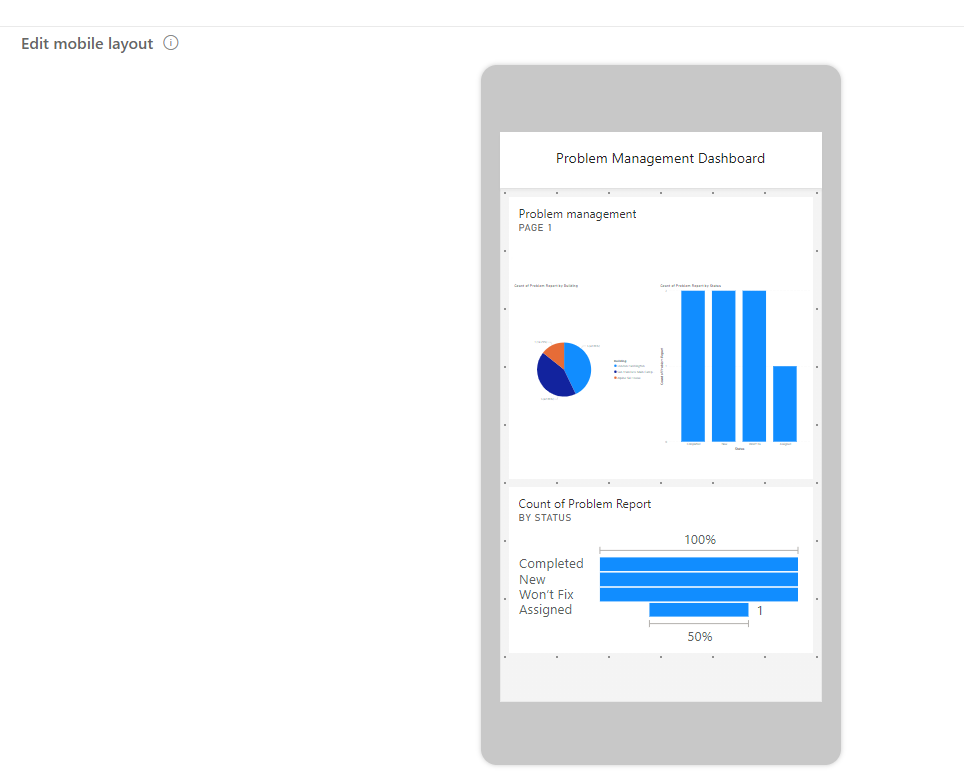
Task 4: Build Mobile Phone View
- Select the Problem Management dashboard from Dashboards area.
- Click Edit and then select Mobile Layout from the drop down box.
- Rearrange tiles as desired.
-
Select your report under **311 Workspace Reports** - Select File and then select Generate QR Code from the drop down box.
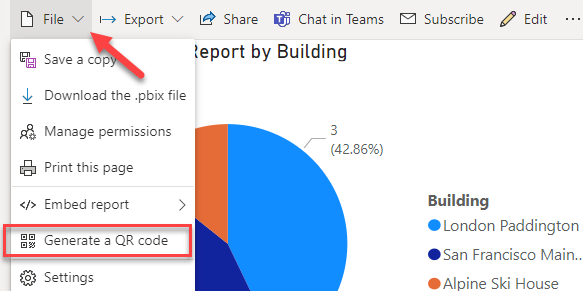
- If you have a mobile device, scan the code using a QR scanner app available on both iOS and Android platforms.
NOTE
To access the dashboard and report you will have to sign in on the phone as the same user.
- Navigate and explore reports and dashboards on a mobile device.
Exercise 4: Embed Power BI report
In this exercise, you will add the Company 311 Power BI report to Microsoft Teams and to the Company 311 Admin Model-driven application as a way for management and staff to be able to view the reports from directly within Teams and the Model-driven application.
Task 1: Setup Company 311 Team
In this task you will setup a Microsoft Teams team for the Lamna Healthcare Company, if you have not done so previously.
-
Navigate to Microsoft Teams and sign in with the credentials you have been using previously.
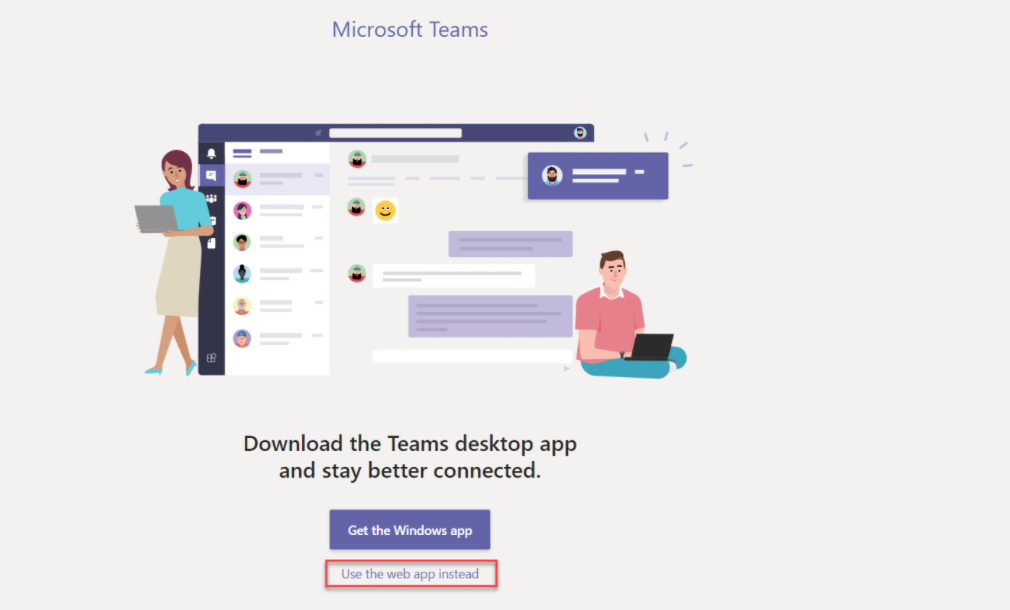
-
Select Use the web app instead on the welcome screen.
-
When the Microsoft Teams window opens, dismiss the welcome messages.
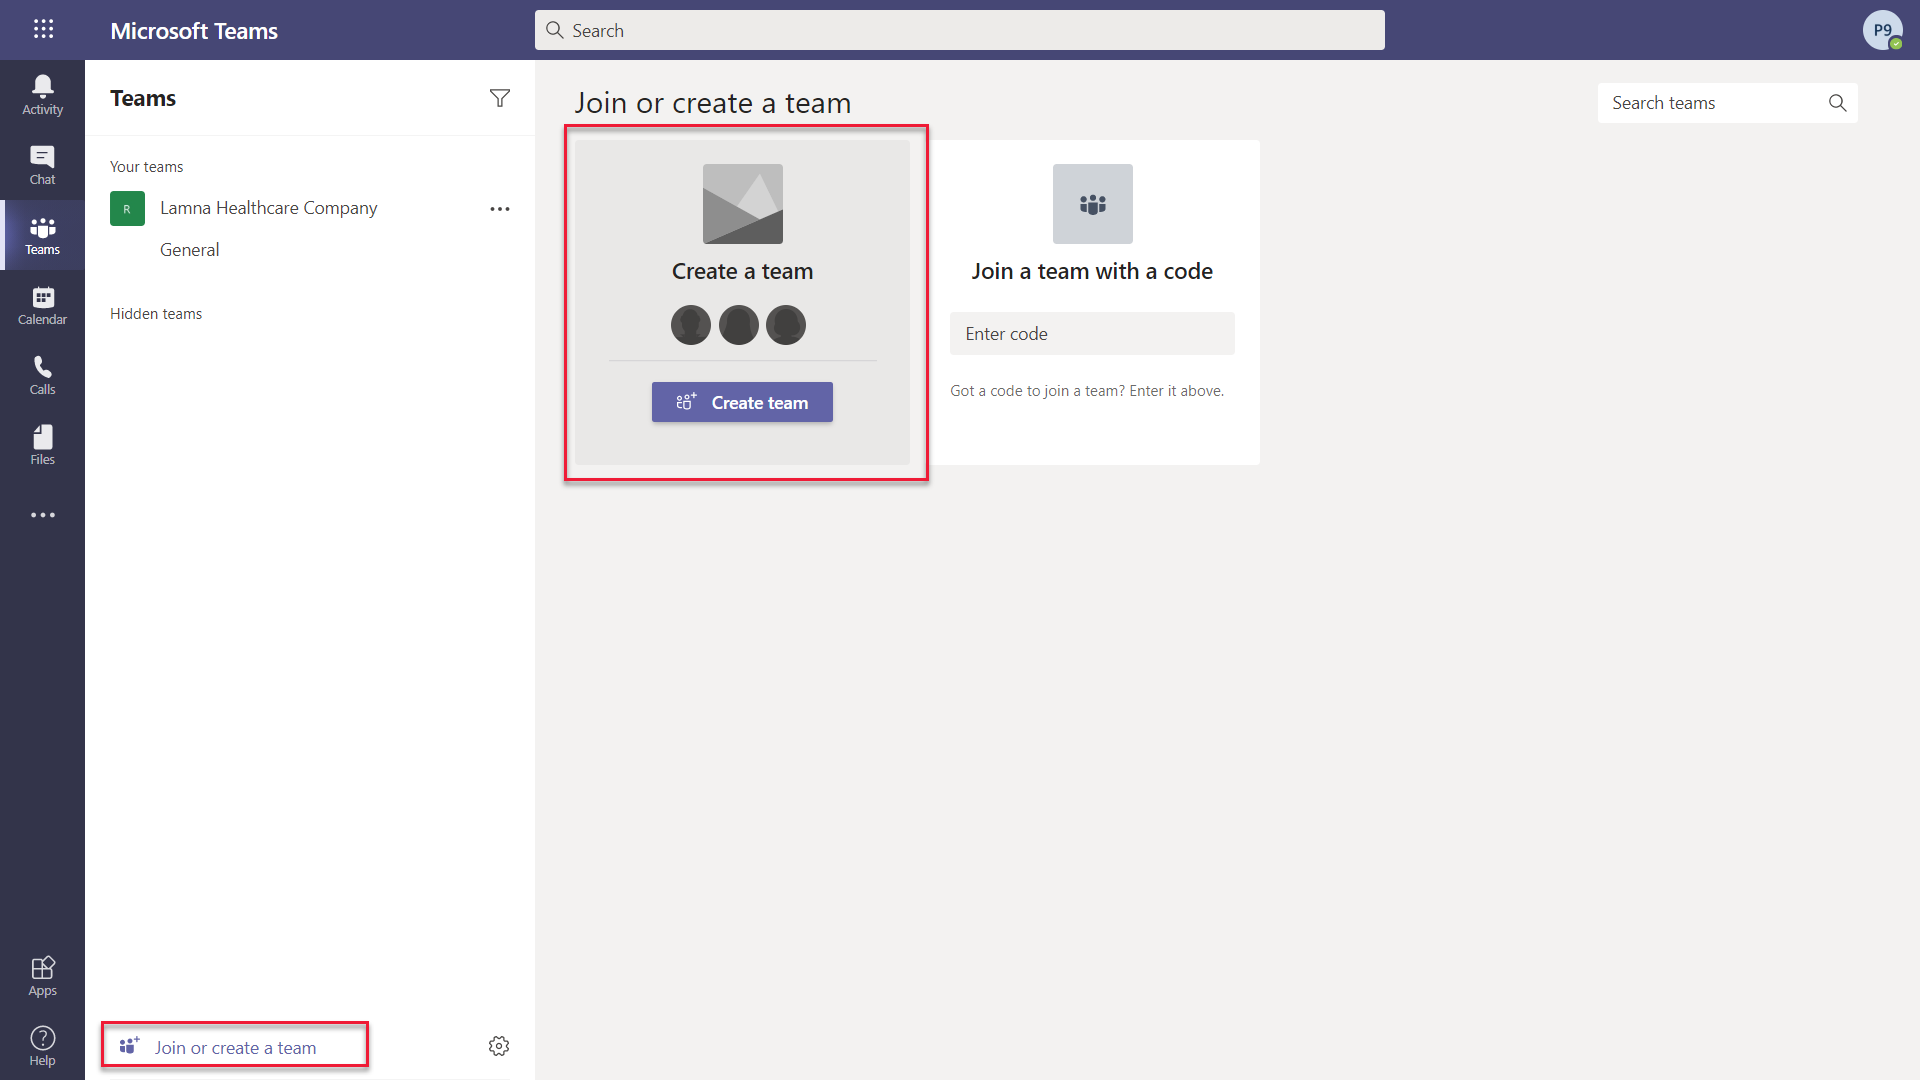
-
On the bottom left corner, choose Join or create a team.
-
Select Create a team.
-
Press From scratch.
-
Select Public.
-
For the Team name choose Company 311 and select Create.
-
Select Skip adding members to Company 311.
Task 2: Embed Power BI report to Teams
-
Navigate to Microsoft Teams.
-
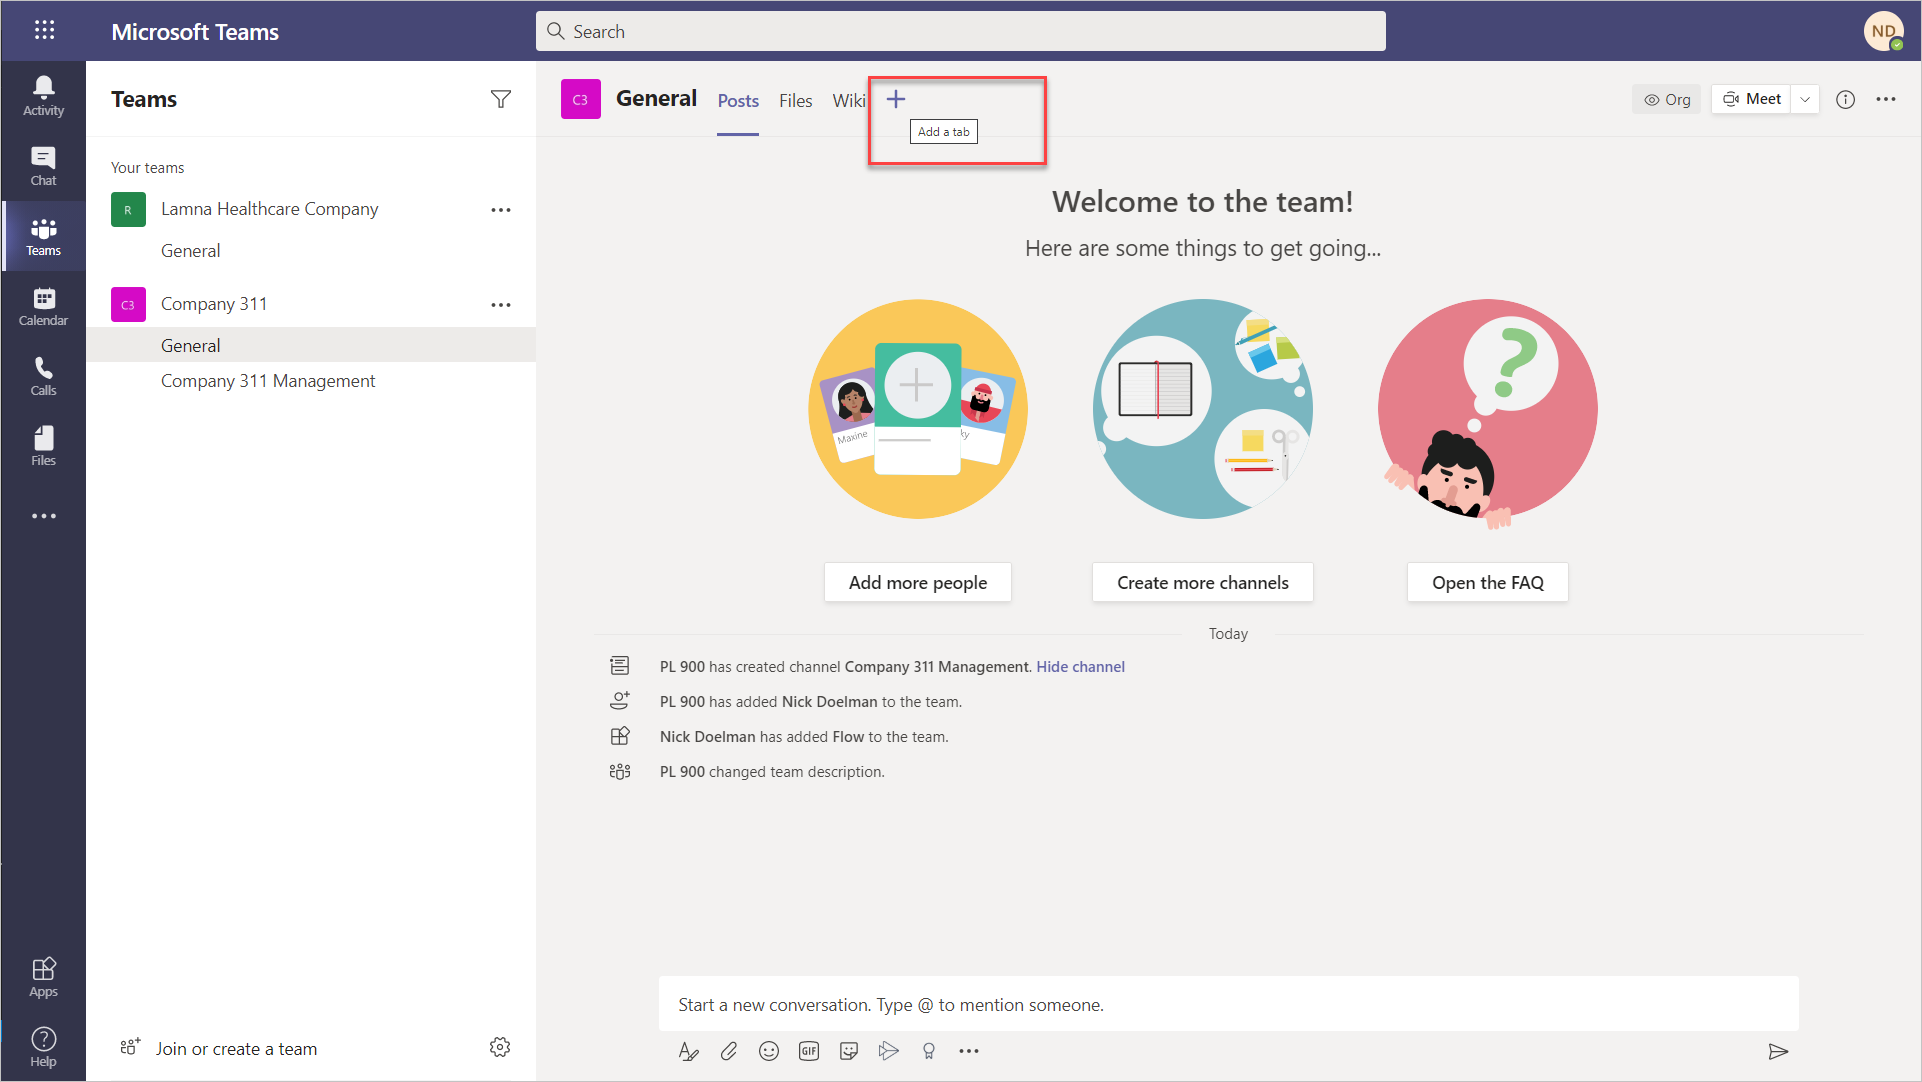
Select the General channel of the Company 311 team.
-
On the top of the page, press the + symbol to add a new tab.
-
Search for power and select Power BI from the results.
-
Expand 311 Workspace and select the report you created earlier in this lab and click Save.
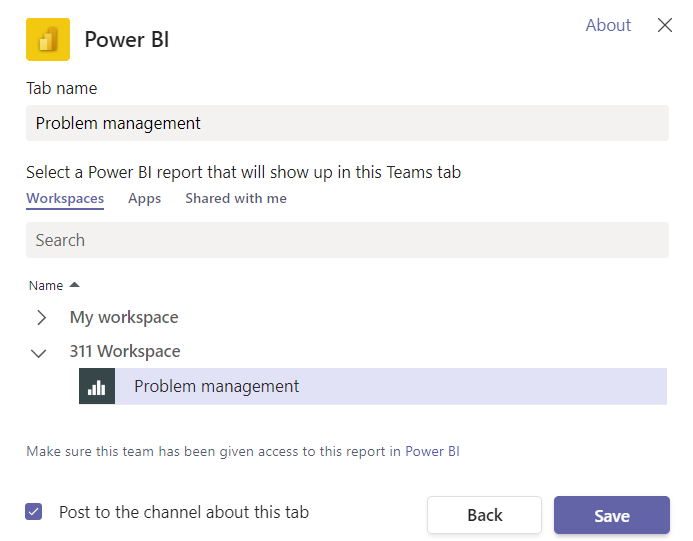
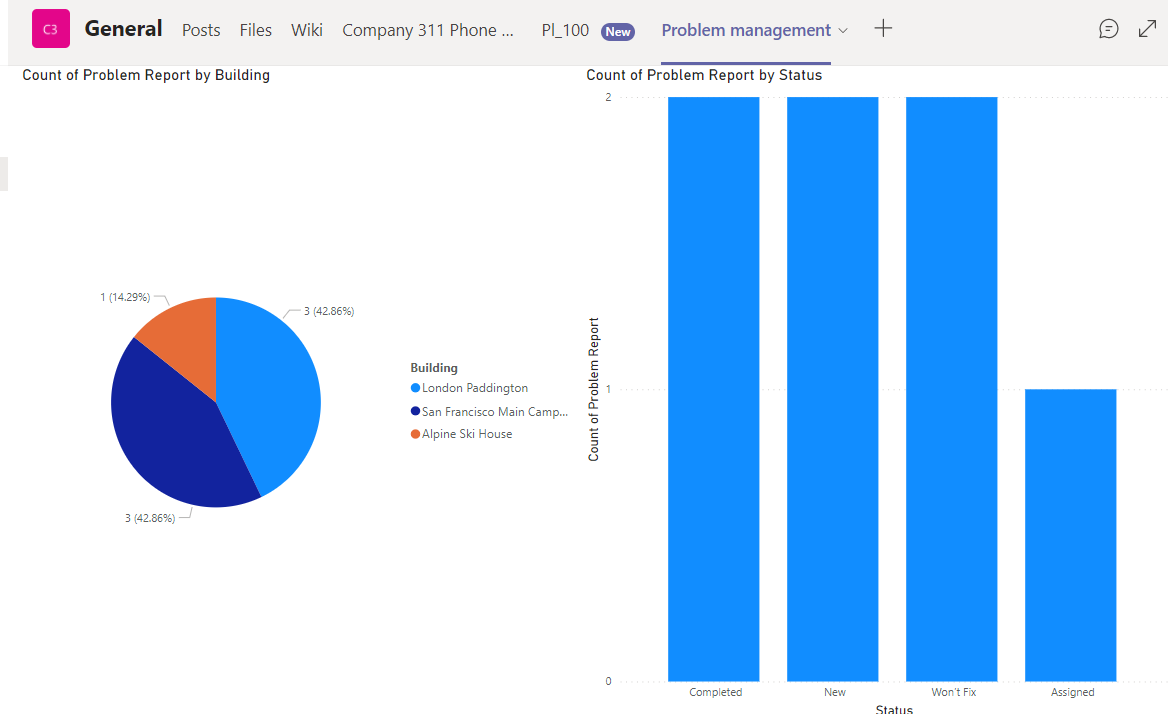
- You should now see your Power BI report in a tab in Microsoft Teams
Task 3: Embed Power BI report to Model-driven app
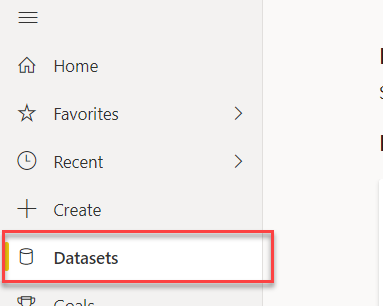
- Navigate to Power BI.
- Click to select Datasets.
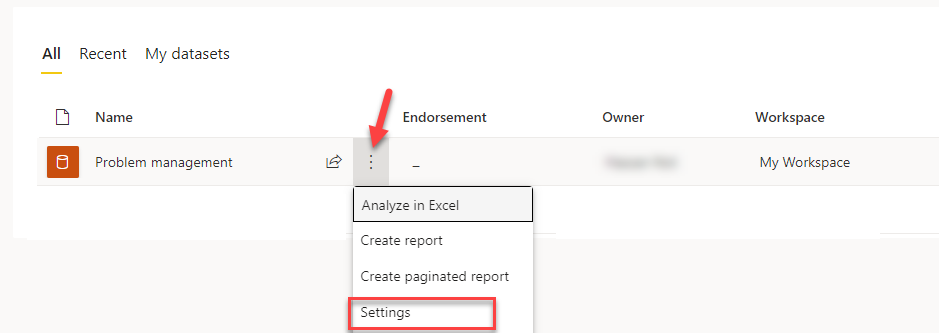
- Hover over the dataset you created, click on the … More options button, and select Settings.
- Click Edit credentials located in the Data source credentials section.
- Select OAuth2 for Authentication method, select Organizational for Privacy level setting, and click Sign in.
- Provide your credentials.
- Navigate to Power Apps maker portal and make sure you are in your practice environment.
- Select Solutions and click to open the Company 311 solution.
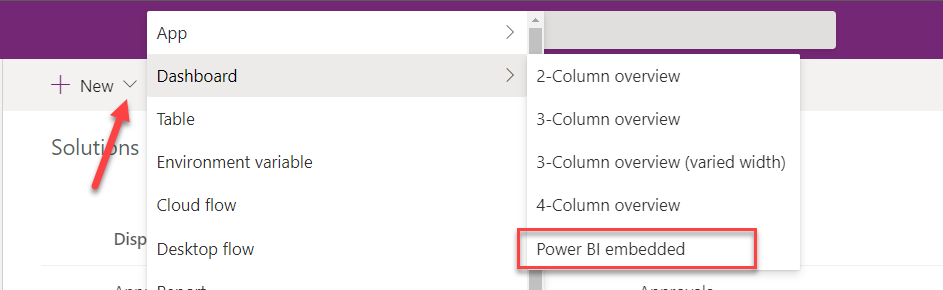
-
Click + New and select **Dashboard Power BI embedded**.
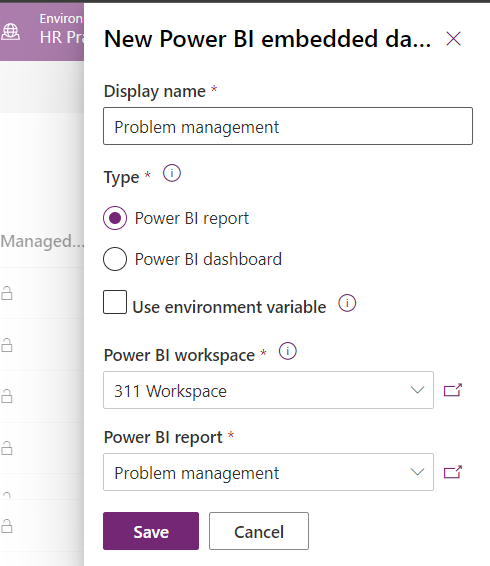
- Enter Problem management for Display name, select Power BI report for type, select 311 Workspace for Power BI workspace, select Problem management for Power BI report and click Save.
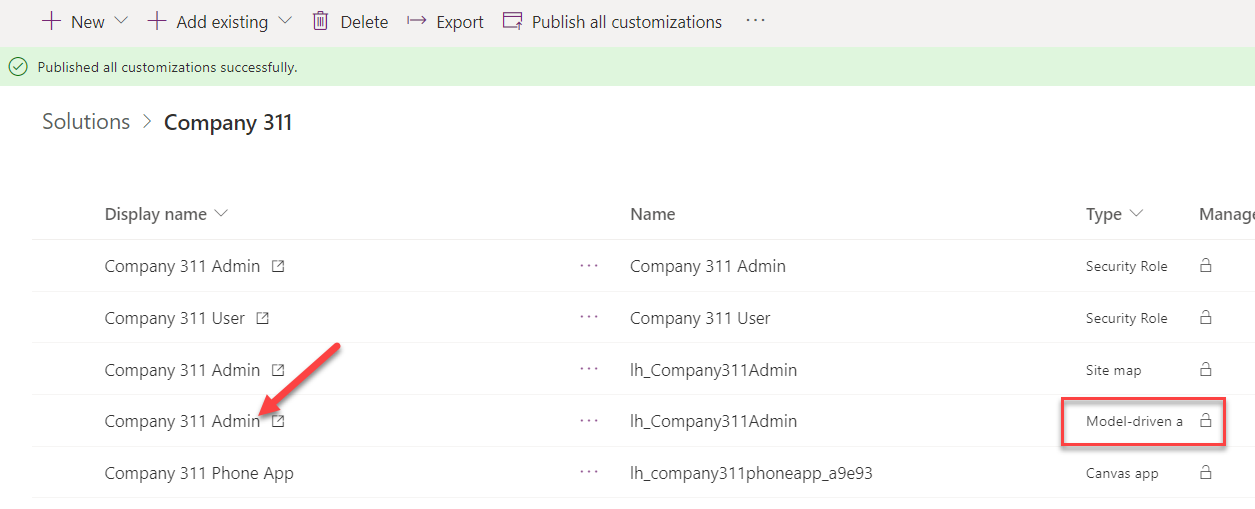
- Click Publish all customizations and wait for the publishing to complete.
- While still in the Company 311 solution, click to open the the Company 311 Admin Model-driven application.
- In app designer select Navigation icon then select Manage Problems area.
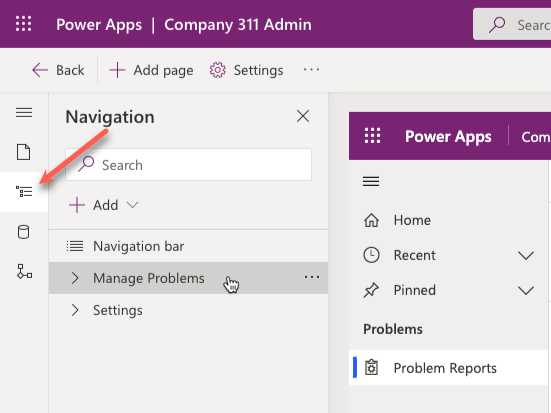
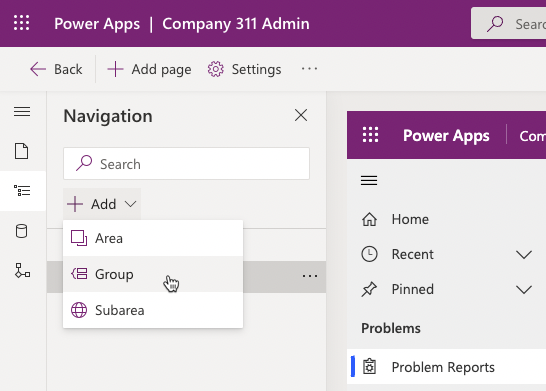
- Click + Add and select Group.
-
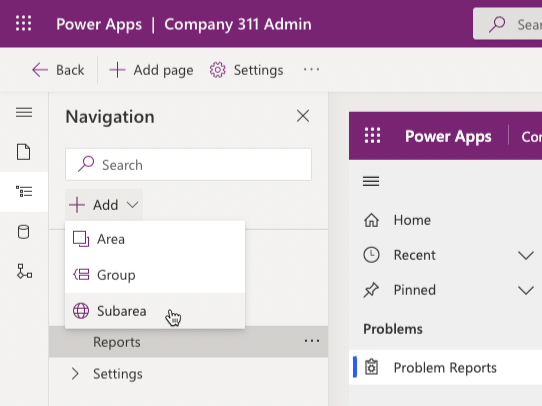
Go to the Properties pane and enter Reports for Title.
-
Select the Reports group you just created, click + Add and select Subarea.
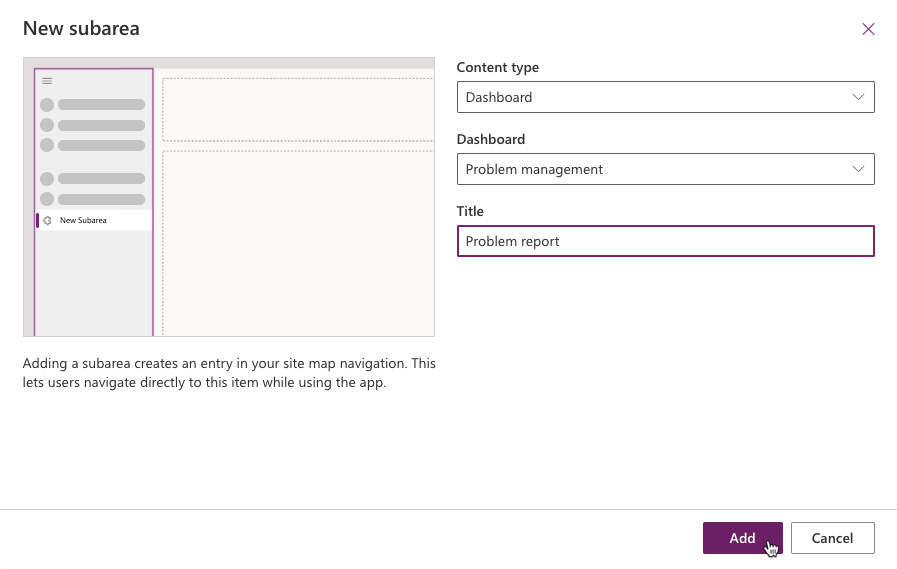
- Select Dashboard for Type, select Problem management for Dashboard, enter Problem report for Title and click Add.
-
Click ellipsis icon next to Reports group and select Move up.
-
Click Save, then click Publish, wait for the publishing to complete and then click Play.
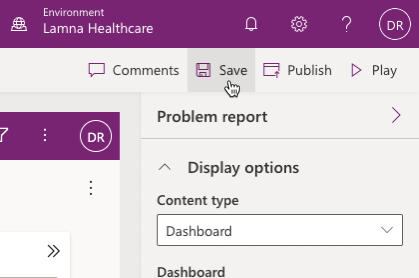
- The report should load.

- Interact with report and make sure it behaves as expected.
Exercise 5: Power BI embedded canvas
In this exercise, you will add embedded canvas application to Power BI as a visual.
Task 1: Add canvas
- Navigate to Power BI.
- Select Workspaces and then select to open 311 Workspace.
- Click to open the Problem management report.
- Click Edit.
- Resize and reposition the visuals as shown below.
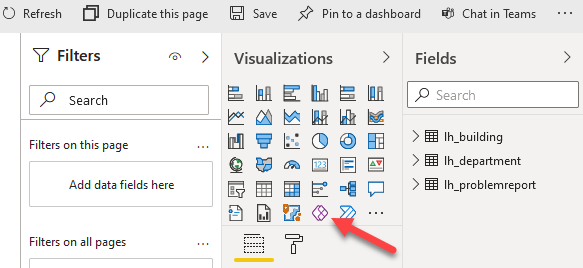
- Click on an empty area of the canvas, go to the Visualizations and click Power Apps for Power BI.
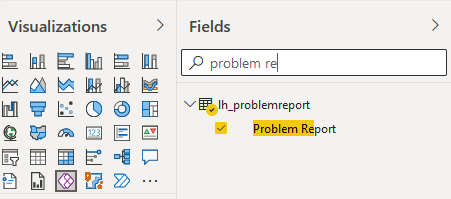
- Select the Power BI visual you just created, expand the lh_problemreport table select Problem Report column.
- Select your practice environment and click Create new.
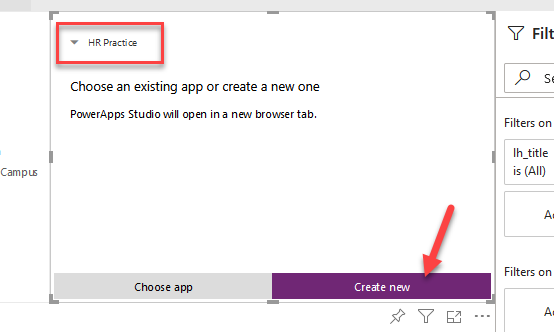
- A new browser window or tab should open and load the app studio.
- Do not navigate away from this page.
Task 2: Customize the app
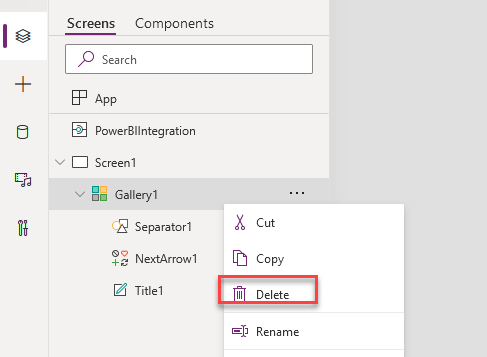
- Right click on Gallery and select Delete.
- Click Settings.
- Select Display.
- Change the Orientation for Landscape and click Apply on the popup.
- Close the Settings window.
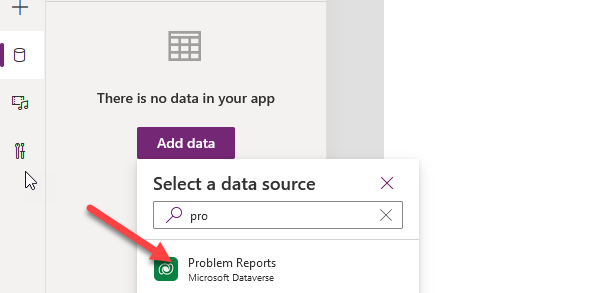
- Select Data and click Add data.
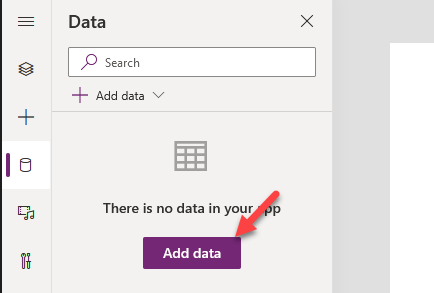
- Select the Problem reports table.
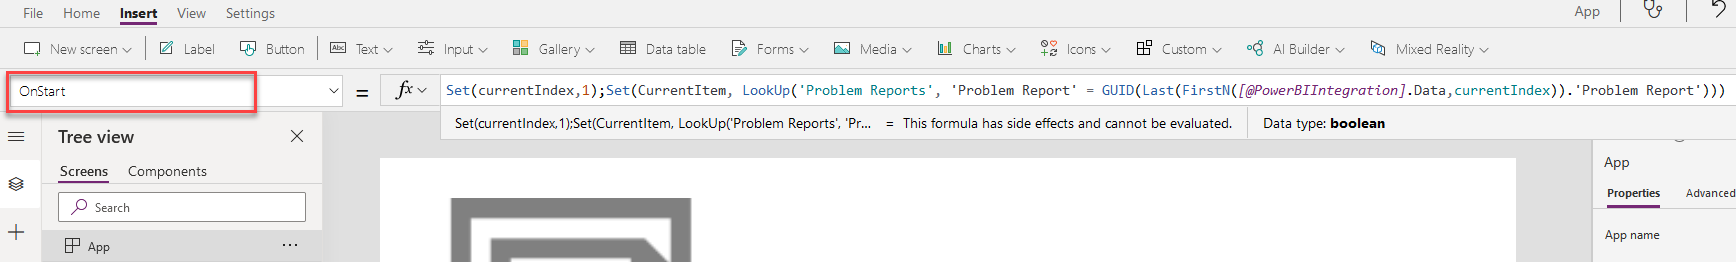
- Select the App object from the Tree view.
- Select the OnStart of the App object and set it to the formula below. This formula will create two variables one to keep track of the current index of the reports table and another to keep track of the current item row.
Set(currentIndex,1);Set(CurrentItem, LookUp('Problem Reports', 'Problem Report' = GUID(Last(FirstN([@PowerBIIntegration].Data,currentIndex)).'Problem Report')))
- Select the + Insert button, expand Media group, then select Image.
14 Set the Image value to the formula below.
CurrentItem.Photo
- Click on the … button of the App object and select Run OnStart.
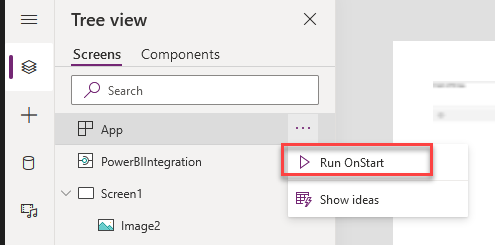
- You should see the photo. If you are not seeing the photo, then go to your Model Driven App and add photo to Problem Reports records where the Photo field is empty.

- Set the X value of the image to 0.
- Set the Y value of the image to 0.
- Set the Width value of the image to the formula below.
Parent.Width
- Set the Height value of the image to the formula below.
Parent.Height
- The image should fill the screen.

- Do not navigate away from this page.
Task 3: Add controls
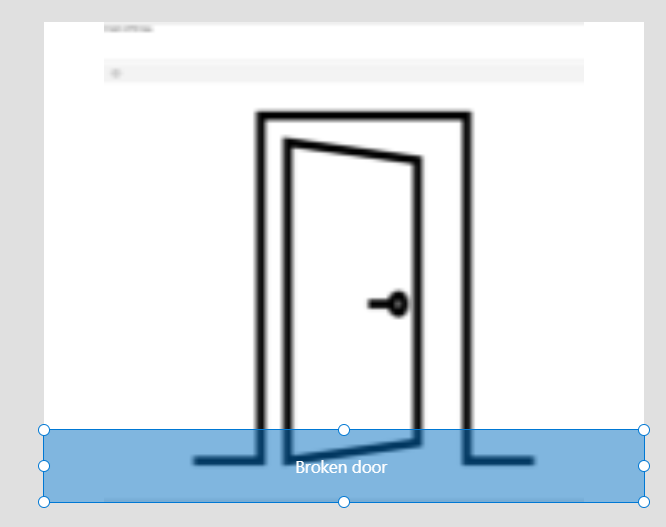
- Select the Insert tab and click Text label.
- Select the label you just added and set the Text value to the formula below.
CurrentItem.Title
- Set the Height value of the labe to 60.
- Set the X value of the label to 0.
- Set the Y value of the label to formula below.
Parent.Height -Self.Height
- Set the the Width value of the label to formula below.
Parent.Width
- Set the Fill value of the label to RGBA(0, 108, 191, .5).
- Set the Color value of the label to RGBA(255, 255, 255, 1).
- Set the Align value to the formula below.
Align.Center
- The label should now look like the image below. If you don’t see the title, click on the … button of the App object and Run OnStart again.
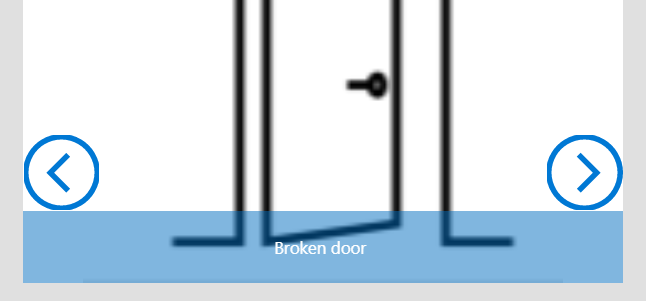
- Select + Insert, enter next in the search box, then select Next arrow under Icons.
- Double click on the name of the icon you just added and rename it Next icon.
- Select + Insert, enter back in the search box, then select Back arrow under Icons.
- Double click on the name of second icon you just added and rename it Back icon.
- Drag and place the the Next icon above the right side of the label.
- Drag and place the the Back icon above the left side of the label.
- The icons should now look like the image below.
- Select the Next icon and set the OnSelect value to the formula below.
UpdateContext({CurrentItem: LookUp('Problem Reports', 'Problem Report' = GUID(Last(FirstN([@PowerBIIntegration].Data,currentIndex+1)).'Problem Report'))});UpdateContext({currentIndex: currentIndex+1})
- Set the DisplayMode value of the Next icon to the formula below.
If(currentIndex = CountRows([@PowerBIIntegration].Data), DisplayMode.Disabled, DisplayMode.Edit)
- Select the Back icon and set the OnSelect value to the formula below.
UpdateContext({CurrentItem: LookUp('Problem Reports', 'Problem Report' = GUID(Last(FirstN([@PowerBIIntegration].Data,currentIndex-1)).'Problem Report'))});UpdateContext({currentIndex: currentIndex-1})
- Set the DisplayMode value of the Back icon to the formula below.
If(currentIndex > 1, DisplayMode.Edit, DisplayMode.Disabled)
- Select + Insert, enter check in the search box, then select Check under Icons.
- Rename the Check icon Complete icon.
- Move the Complete icon to the top right of the screen.
- Set the OnSelect of the Check icon to the formula below. This formula will update the status of the row to completed and then refresh Power BI.
Patch('Problem Reports', CurrentItem, {'Status Reason': 'Status Reason (Problem Reports)'.Completed}); PowerBIIntegration.Refresh()
- Click Play.
- Click on the next and back icons and make sure the image changes.
-
Close the preview.
- Click Save button.
- Enter Power BI embed app for Name.
- Click Save.
- Click Publish button.
- Close the app studio browser window or tab.
- You should now be back on the Power BI report. Click Refresh on the top header.
-
Click on the Next and Back icons to make sure the application loads the images.
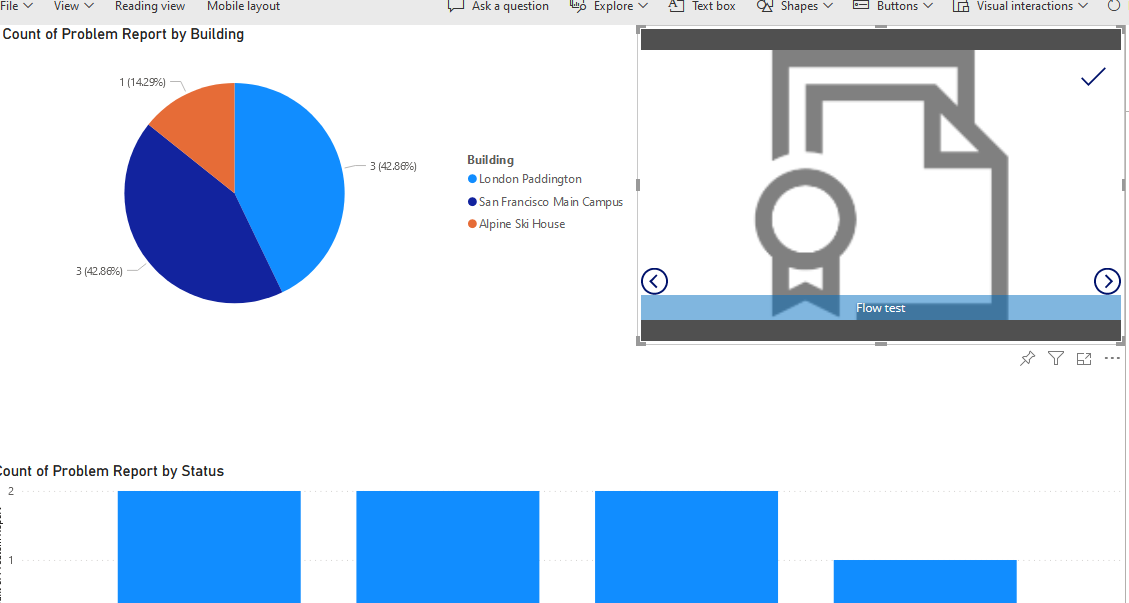
- Select the Completed column of the stacked column chart and make a note how many rows are completed.
- Select any column of the stacked column chart apart from Completed. Click on the next icon to see the next image.
-
Click on the Complete icon.
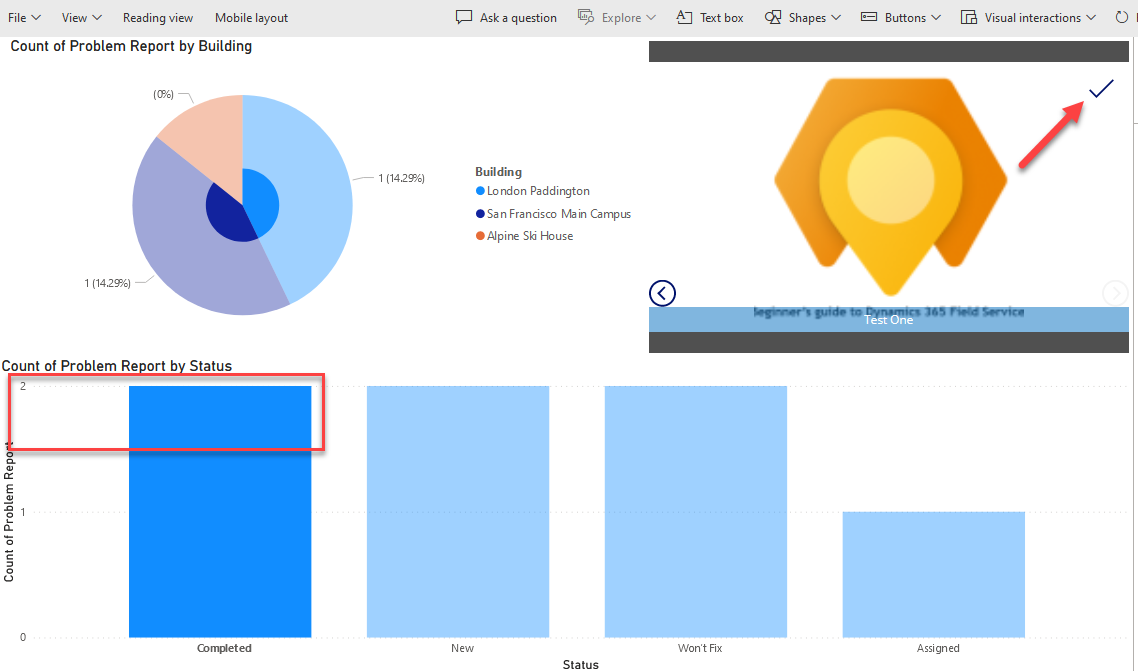
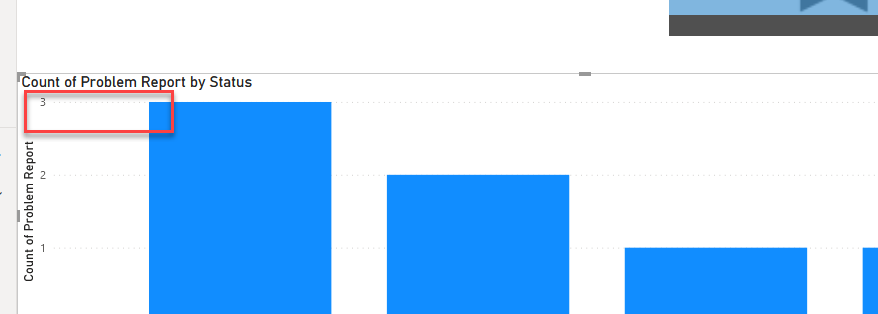
-
The completed count should increase. If the completed count doesn’t increase, click refresh and wait for the visuals to be refreshed.
- Click Save to save the report..
Challenges
- Dashboards and reports to include drilldown to individual reports with photos
- Report and analyze problem patterns and trends
- Problem resolution status visualization as a funnel
Addendum
Import sample data
In this exercise you will import sample data into Power BI service. That allows you to complete the lab exercises even if do not have required permissions to install desktop applications, or experience difficulties in configuring Power BI Desktop and connecting it to the data. After completion of this exercise you can skip Exercise1 and start the lab on Exercise 2 using Power BI service (https://app.powerbi.com) instead of Power BI Desktop.
- Download problem-reports-data.pbix and save on your computer.
- Navigate to Power BI.
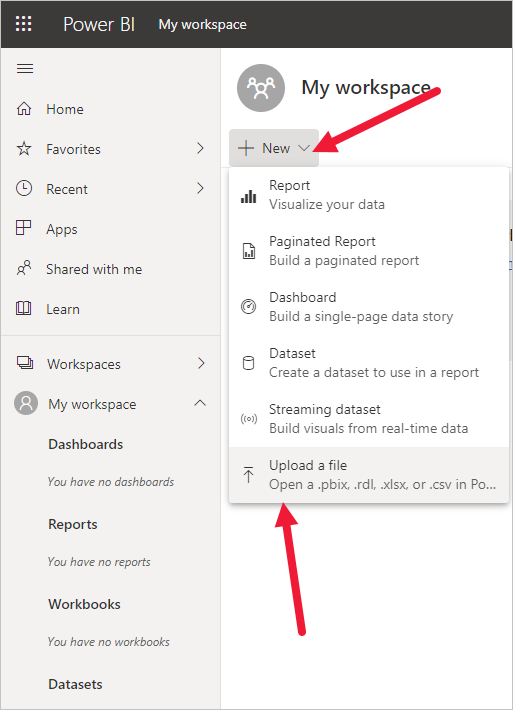
- Click 311 Workspace.
- Expand +New and select Upload a file.
- Select Local File.
- Locate and select problem-report-data.pbix file that you’ve downloaded earlier.
- Once data load is complete, select problem-reports-data report.
- Click … then select Edit.
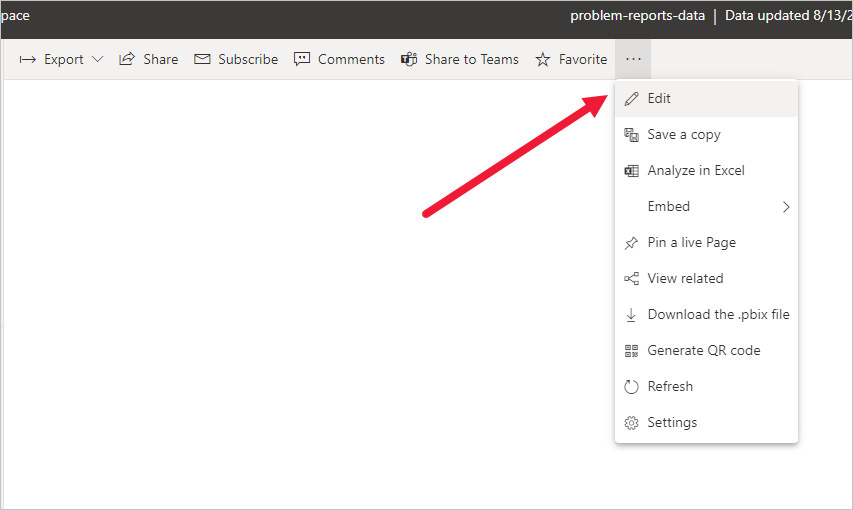
- You can now start Exercise 2: Create Power BI Report of this lab.
NOTE
The sample data contained in pbix file may differ from the data present in the Dataverse instance. If reports are built using imported file, some of the visual elements and functionality may vary as a result.